Separate the chart from the host
An iframe keeps the chart’s styles and runtime isolated. The same product can appear on sites built with different platforms without requiring each owner to install a frontend package.
Data visualization · Web / Case study
River data, ready for any website.
A configurable charting product that makes USGS river conditions easy to explore and embed in fishing reports and other websites.
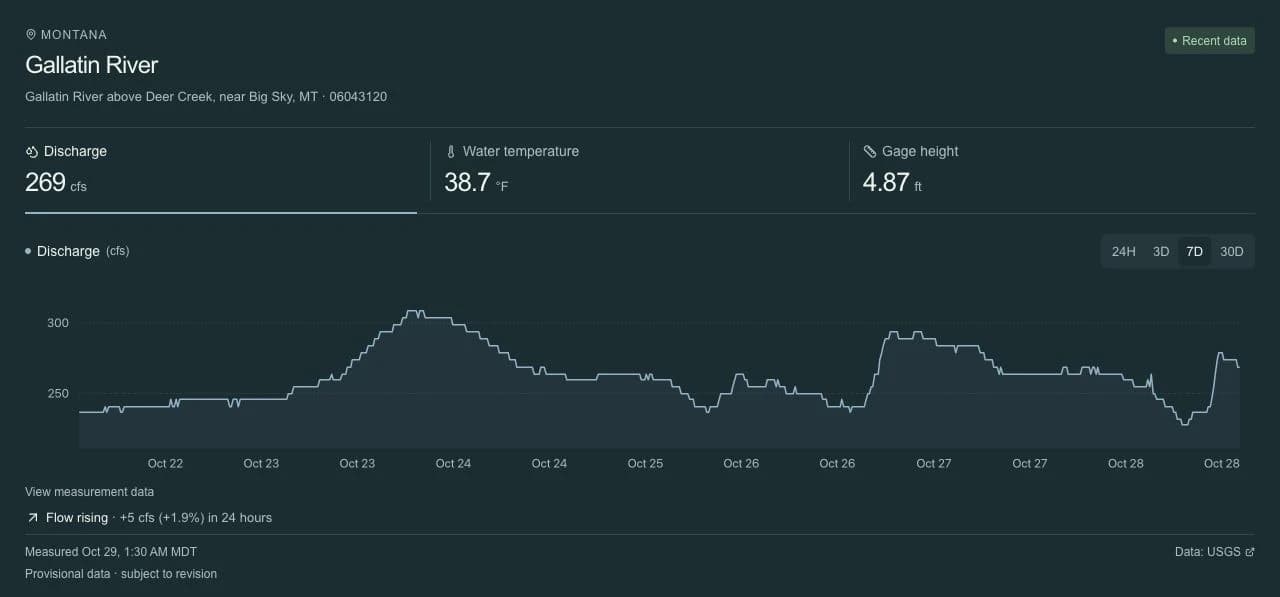
A real capture of the chart product. To explore current measurements, open Buggin Charts .
01 / The problem
River information is useful well beyond a dedicated fishing app. A fishing report or guide’s website needs a reliable, readable way to show current conditions without building its own data integration.
02 / My solution
I developed a reusable chart system with a visual configuration workflow. Website owners choose a USGS station, measurements, time range, and appearance, then copy an embed into their own site.
03 / System overview
Server-side requests retrieve station metadata and observations, with validated responses, normalized time series, and caching.
React and uPlot render responsive charts. Controls expose measurement types and time ranges alongside timestamps and data-quality information.
Validated URL parameters configure an isolated iframe. A companion resize script lets the embed fit its content on the host page.
04 / Engineering decisions
An iframe keeps the chart’s styles and runtime isolated. The same product can appear on sites built with different platforms without requiring each owner to install a frontend package.
The data layer validates responses and handles timeouts and upstream errors. Measurement timestamps, provisional-data labels, and missing-data states keep the interface honest about what is available.
The station and validated display options are represented in the embed URL. That makes a configuration portable and reproducible without requiring an account or a custom integration.
05 / Where it stands
Buggin Charts is available as a working web product with a chart builder, live examples, and an embedding guide. It extends the Buggin ecosystem into a reusable tool for other websites.
Contact
I’m open to software engineering opportunities and technical collaborations.